Home
الدخولسجل
مستعد للتداول؟
سجل الآن

Graphical Analysis Simplified

Ever wondered how traders foresee market movements just by looking at a chart? The secret lies in mastering graphical analysis, a skill that can transform your trading decisions and elevate your success!

  1. Graphical analysis basics
  2. Trend recognition
  3. Support and resistance
  4. Trend reversals
  5. A chart-reading routine

Graphical analysis basics

Start by looking at the price chart without trying to predict the next move. Instead, focus on what the price has already been doing.

Look for:

  • The overall direction: Is price generally moving up, down, or sideways?

  • Recent highs and lows: Are they moving higher or lower?

  • Repeated price levels: Does price regularly stop or turn around around the same area?

  • Changes in behaviour: Is the price movement starting to look different from the earlier trend?

Using this simple checklist helps you read the chart systematically rather than reacting to every individual price movement.

Trend recognition

Trend recognition gives you the broader direction of the market. It’s a good place to start.

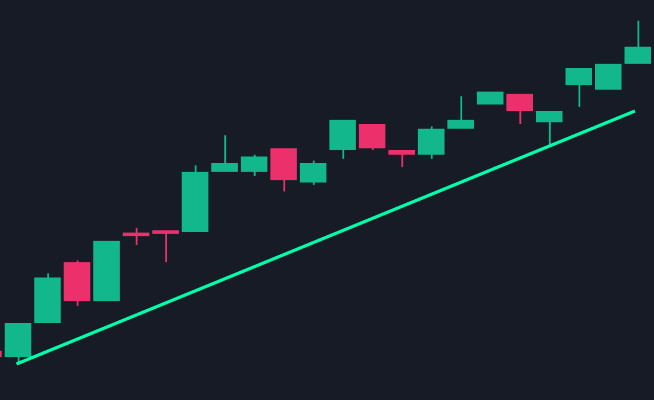
Look at the sequence of highs and lows. Higher highs and higher lows suggest an upward trend, while lower highs and lower lows suggest a downward trend. If neither pattern is clear and price keeps moving within a similar range, the market may be sideways.

That said, don't base your decision on just a single high or low. Zoom out and check whether the same pattern continues across several timeframes. You can then use the platform's charting and analysis tools to look at the trend in more detail.

Ed 201, Pic 1

Support and resistance

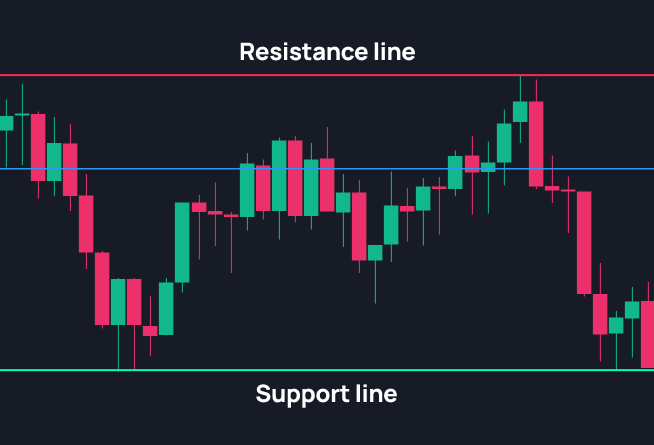
Next, look for areas where price has repeatedly struggled to move through or has changed direction. These are commonly referred to as support and resistance levels.

You can mark these areas on the chart by looking for previous points where price repeatedly bounced, stalled, or reversed. They can help you understand where price may face pressure if it reaches the same area again.

See our Support and Resistance guide for a more detailed explanation of how to identify and use these levels.

Ed 201, Pic 2

How to spot a trend reversal

Once you've identified the current trend, watch for signs that its structure is changing.

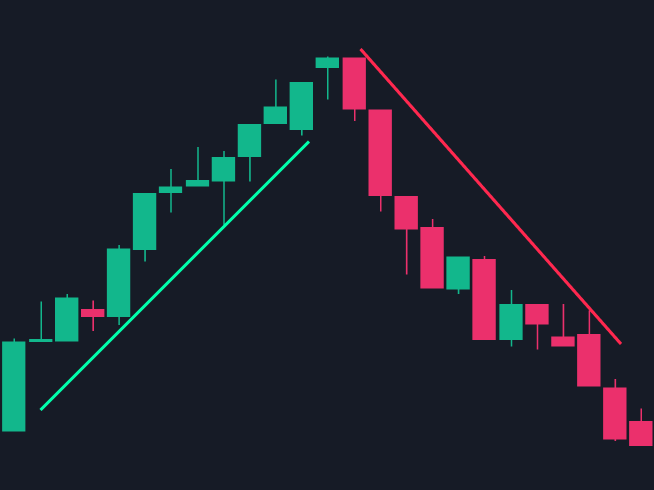
For an upward trend, watch for signs that the pattern of higher highs and higher lows is breaking down. For example, if price forms a lower high and then a lower low, it may indicate that the upward trend is weakening. The opposite applies to a downward trend: if price stops making lower highs and lower lows and starts forming higher highs and higher lows, it may signal that the downward trend is losing strength and a reversal could be developing.

A break of an important support or resistance level can also provide another clue. However, one price move isn't enough to confirm a reversal. Look for a change in the overall price structure and, where appropriate, use other charting tools for confirmation.

Ed 201, Pic 3

A simple chart-reading routine

When analysing a chart, you can work through these steps:

  • Start with the bigger picture. Identify whether the market is moving up, down, or sideways.

  • Check the price structure. Look at the most recent highs and lows.

  • Mark important levels. Note areas where price has previously reversed or stalled.

  • Watch for changes. Check whether the current pattern is continuing or beginning to break down.

  • Use your analysis tools. Add indicators or change the chart timeframe if you need more context.

  • Wait for confirmation. Avoid treating a single price movement as proof of a new trend or reversal.

Graphical analysis is ultimately about putting these observations together rather than relying on one pattern or level. With practice, it’ll be easier for you to actually read and understand the chart.

مستعد للتداول؟
سجل الآن
ExpertOption

لا تقدم الشركة خدمات للمواطنين و/أو المقيمين في أستراليا والنمسا وبيلاروسيا وبلجيكا وبلغاريا وكندا وكرواتيا وجمهورية قبرص وجمهورية التشيك والدنمارك وإستونيا وفنلندا وفرنسا وألمانيا واليونان والمجر وأيسلندا، إيران، أيرلندا، إسرائيل، إيطاليا، لاتفيا، ليختنشتاين، ليتوانيا، لوكسمبورغ، مالطا، ميانمار، هولندا، نيوزيلندا، كوريا الشمالية، النرويج، بولندا، البرتغال، بورتوريكو، رومانيا، روسيا، سنغافورة، سلوفاكيا، سلوفينيا، جنوب السودان، إسبانيا، السودان، السويد، سويسرا، المملكة المتحدة، أوكرانيا، الولايات المتحدة الأمريكية، اليمن.

متداولين
برنامج شراكة
Partners ExpertOption

طرق الدفع

Payment and Withdrawal methods ExpertOption
ينطوي التداول والاستثمار على مستوى كبير من المخاطر وهو غير مناسب و/أو مناسب لجميع العملاء. يرجى التأكد من أنك تدرس بعناية أهدافك الاستثمارية ومستوى خبرتك ورغبتك في المخاطرة قبل الشراء أو البيع. ينطوي الشراء أو البيع على مخاطر مالية وقد يؤدي إلى خسارة جزئية أو كاملة لأموالك، لذلك لا ينبغي عليك استثمار أموال لا يمكنك تحمل خسارتها. يجب أن تكون على دراية وفهم كامل لجميع المخاطر المرتبطة بالتداول والاستثمار، وطلب المشورة من مستشار مالي مستقل إذا كانت لديك أي شكوك. يتم منحك حقوقًا محدودة وغير حصرية لاستخدام الملكية الفكرية الموجودة في هذا الموقع للاستخدام الشخصي وغير التجاري وغير القابل للتحويل فقط فيما يتعلق بالخدمات المقدمة على الموقع.
نظرًا لأن شركة EOLabs LLC لا تخضع لإشراف JFSA، فهي غير متورطة في أي أعمال تعتبر بمثابة تقديم منتجات مالية وطلب خدمات مالية لليابان وهذا الموقع لا يستهدف المقيمين في اليابان.
© 2014–2026 ExpertOption
ExpertOption. جميع الحقوق محفوظة.